Parala, 14 March 2023
Emerging Market Equity Risk Factors Sensitivity to the Business Cycle
The business cycle and its influence on asset prices
It is common knowledge that the business cycle moves through stages in which it expands, contracts and recovers and these stages have an influence on asset prices. During the early stage of a recovery, stocks and commodity prices tend to rise and during a contraction stock prices tend to weaken while bond prices strengthen. The returns of equity sectors are also sensitive to the business cycle. Industrials and financials tend to strengthen during the early stage of a recovery while technology stocks begin to shine as the business cycle moves into an expansion. Finally, the business cycle has demonstrably impacted risk premia for factors such as Size, Value, Momentum and Quality. For example, Value stocks doing particularly well in periods of recovery and less well during contractions. These relationships, of course, do not always hold and vary across markets. In addition, there is the complexity of identifying the current state of the economy as the stages of the business cycle are better understood in hindsight. This article specifically focuses on a less explored segment of the market, looking at the variability of risk premia across the business cycle in emerging markets (‘EM’s).
Analysis description
Six EM equity factors were analysed over the period 2007 to 2020 when they had full return histories including Market, Size, Style, Quality, Momentum, Dividend Yield and Low Volatility. Macroeconomic variables were selected to represent the business cycle including default spread, term spread, short rate and inflation. The sensitivities of each EM equity factor to these business cycle variables was estimated. We also looked at indices from different providers and found that differences in index methodologies can lead to differences in business cycle sensitivities even for the same risk factor.
A look across EM risk factor
The table below shows the latest business cycle sensitivities for twelve EM factors at 31 January 2020. The values can be thought of as the macroeconomic betas for the EM equity risk factors. The most meaningful comparison is for each business cycle variable column.
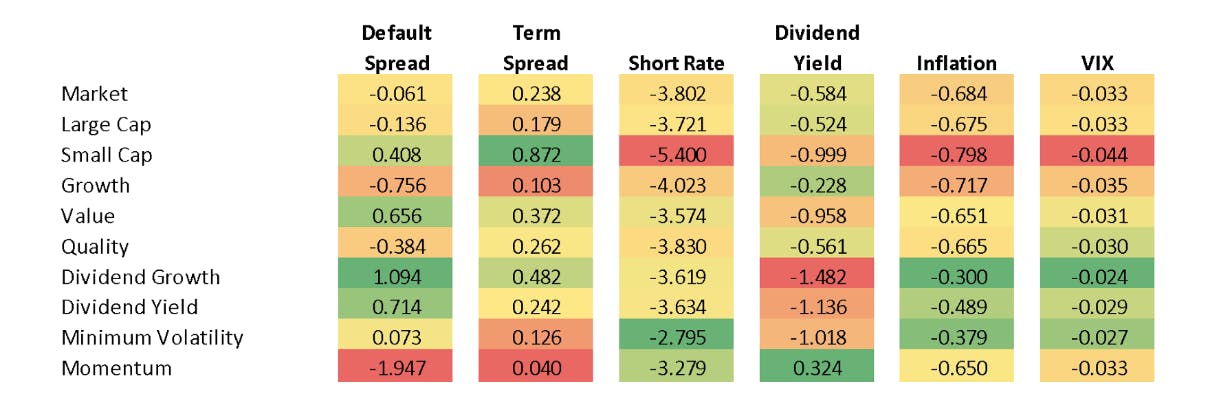
The results show that the majority of EM risk factors have different business cycle sensitivities with the exception of the market and large cap risk factors which have low tracking error due to the market cap-weighting of both these indices. The sensitivities are a useful guide for how securities are expected to perform in certain macroeconomic environments. As an example, if default spreads were to widen due to a credit crisis or general deterioration in economic conditions then having EM exposures with a positive sensitivity to the default spread such as the Dividend and Value factors would do better in relative terms than Growth exposure, which is likely to underperform due to its negative sensitivity to this macroeconomic variable. This is exactly what happened during 2007 – 2008. The US default spread (Baa – Aaa corporate yields) rose from 92 basis points in January 2007 to 3.37% by December 2008 and Dividend and Value factors outperformed Growth.
Cumulative performance 2007 – 2008 when the default spread widened
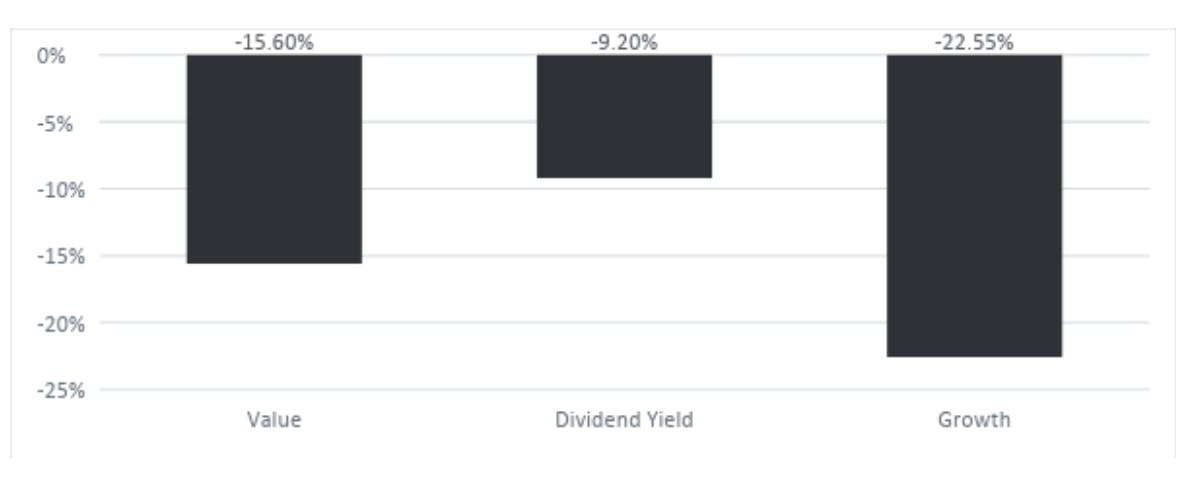
If an investor assumes that default spreads will continue their tightening trend of the past decade, then the case for holding Growth and Momentum factor exposures is strong. Rising inflation tends to have a negative impact on long duration and risk assets like equities. In a period of rising inflation, the EM equity risk factors with the lowest sensitivity to inflation are Dividend Growth and Minimum Volatility whereas Small Cap and Growth would be expected to do better during periods of falling inflation due to their higher negative sensitivity. This was the case in 2009 when inflation growth turned negative. Having an understanding of EM equity risk factor sensitivities to the business cycle and a ‘house view’ of current business conditions or how they are likely to change, can be helpful in determining which EM risk factors are more or less attractive to hold.
Same risk factors from different index providers show differences in business cycle sensitivities
Many index providers publish factor indices for the same category and ETF sponsors choose which reference index to use to provide investors with investable exposures. The table below shows that even within the same category, the EM factor indices have different business cycle sensitivities. This is understandable given differences in methodologies but it does mean that one should expect different performance across the business cycle as macroeconomic conditions change
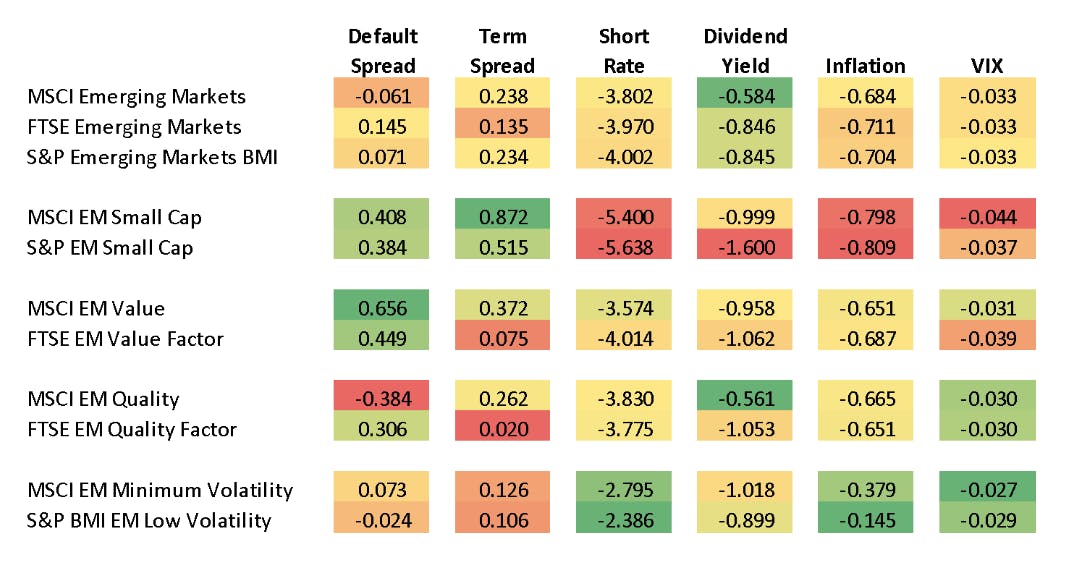
For example, S&P EM Small Cap Index has a lower (positive) sensitivity to the term spread than MSCI EM Small Cap Index so if the term spread tightened (or went negative) as it did recently, you would expect the S&P EM Small Cap Index to perform better and it did. In 2019, the US Term Spread (10 year minus 3 month yield) tightened 73 basis points between January and August and a global measure of the term spread using 10 year minus 1 year government bond yields was negative throughout the year. During 2019, the S&P EM Small Cap Index outperformed the MSCI EM Small Cap Index by 5.40%. It also has a lower (negative) sensitivity to VIX so if VIX were to spike dramatically, you would see less of an impact on the S&P EM Small Cap Index. If these macroeconomic variables moved the other way then the MSCI EM Small Cap would benefit more. Moving onto to the EM Quality factor, we can see that the FTSE EM Quality Factor Index has a positive sensitivity to the default spread whereas the MSCI EM Quality Index has a negative sensitivity. If default spreads where to increase than the FTSE EM Quality Factor Index would benefit whereas the MSCI EM Quality Index would be negatively impacted. This happened in 2018, when a measure of the global default spread (intermediate corp Baa minus treasury yield) rose 76 basis points between January and December. During this period, the FTSE EM Quality Index outperformed the MSCI EM Quality Index by 4.82%. If default spreads were to tighten, all else being equal, then MSCI EM Quality is better positioned. You can see evidence of this between 2009 to 2013 as credit conditions improved, the MSCI EM Quality Index outperformed.
Sensitivities change over time
In order to consider how to best select and combine EM equity factor exposures, one must have a methodology (or system) which is able to evaluate the combinations of business cycle sensitivities simulataneous. Additionally, one must take into account that the EM equity risk factors sensitivity to different macroeconomic conditions will change across the business cycle just as it is true that the EM equity factor indices have different sector exposures which may also change through time.
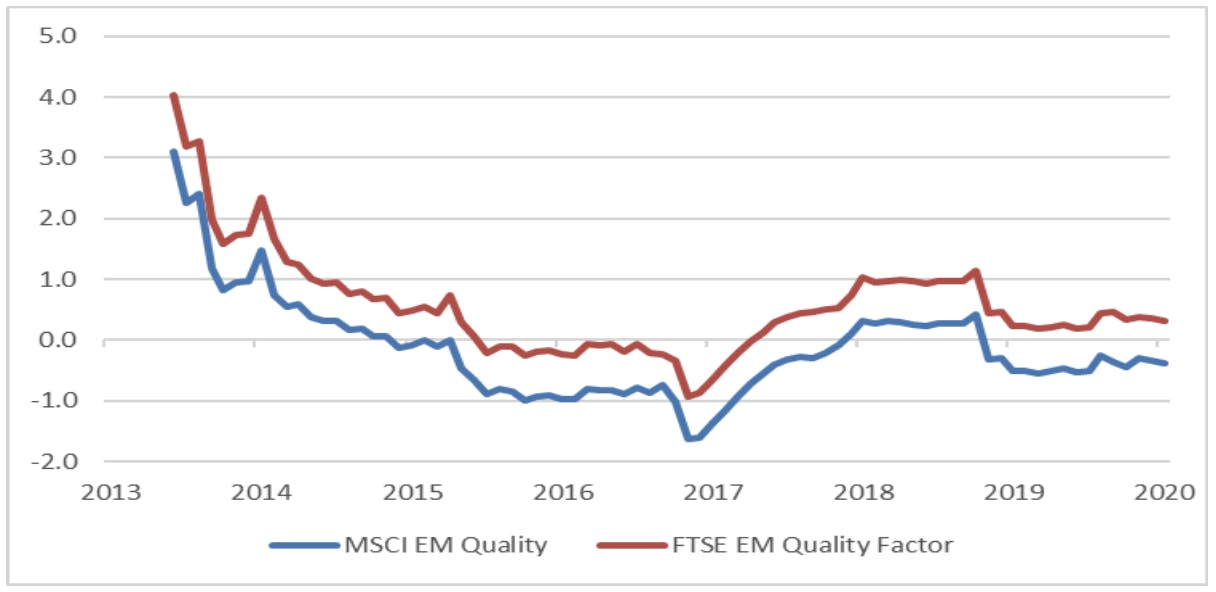
Changing sensitivity of MSCI EM Quality and FTSE EM Quality Factor Indices to the default spread
If we return to the comparison between the MSCI EM Quality and FTSE EM Quality Factor indices, we mentioned that the MSCI EM Quality Index had a negative sensitivity and the FTSE EM Quality Factor Index a positive sensitivity to the default spread as at January 2020. The above chart shows how the sensitivity of these two indices to the default spread has changed over time. We can see that understanding the sensitivity of EM equity risk factors to the business cycle can add substantial value when evaluating how these factors are likely to be impacted by changing macroeconomic conditions. It is also true that when considering how to combine different factor exposures, it is useful to have a methodology (and system) that is able to consider the impact of a range of macroeconomic conditions simultaneously while taking into account that these sensitivities will change over time.